Year 10 Smartie Probability Task
- 7 Oct 2021

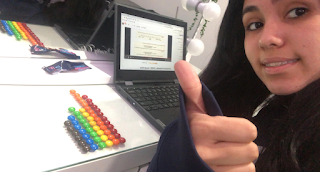
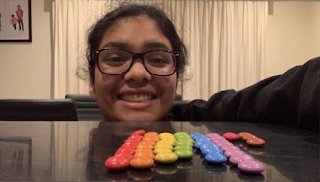
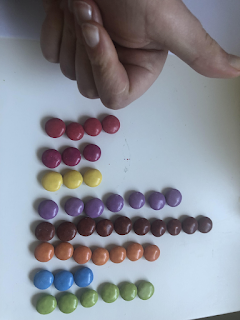
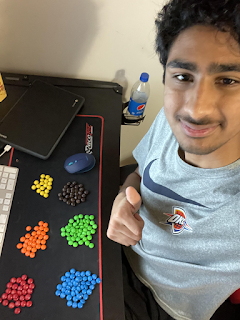
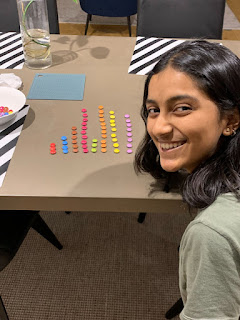
During the Term 3 remote learning, Mrs Nayyar’s Maths Methods students conducted an experiment to test the probability of the various smartie colours received in a 50g packet, as part of the current probability unit we are studying.
In total, we sorted through 969 smarties to discover that orange was our most frequently occurring colour, with 137 smarties, while pink was our least frequently occurring colour, with only 112 smarties.
Overall, we thoroughly enjoyed this task, especially because it was a great way to disengage from our screens and it sparked collaborative ideas across the board, with the best part of the experiment being able to eat the smarties at the end!
James B, Elly B, Gianna C, Leo L, Nadya M, Alice P, Eran R